- Academic Signal
- Posts
- The Bubble Premium Playbook
The Bubble Premium Playbook
Bubbles aren’t just noise. A new model shows how to price speculation, exploit the upside, and manage exits for better risk-adjusted returns.


Actionable insights from academic research.
Welcome to Academic Signal, where we decode finance research into plain English to surface ideas that matter to professional investors.
This week we're covering new research from Cornell and the University of Sydney (“Riding a Bubble,” July 3 2025) that extracts a “bubble premium” from options prices and shows that riding, then exiting, these frothy periods can earn 6.39% annually versus 4.86% for buy-and-hold. Bubbles are thus measurable and—if paired with disciplined exits—potentially lucrative, though timing risk and trading costs still bite. Strip out the algebra and the playbook is simple: price the froth, lean in while it swells, and step away before gravity wins.
How to quantify and trade bubbles profitably
Researchers from Cornell and U Sydney showed 6.39% annual returns vs 4.86% for a buy-and-hold strategy by quantifying and exploiting ‘bubbles’
Riding a Bubble: A Study of Market-Timing Trading Strategies (July 3rd, 2025) Link to paper
From tulip mania to dot-com euphoria, markets repeatedly detach from fundamentals in ways that seem to defy rational explanation. New research from Cornell and University of Sydney measures bubbles and tests different trading approaches to exploit them.
TLDR: Use this paper to calculate the “frothiness” in your portfolio’s prices and adjust your allocations accordingly. That doesn’t mean “sell the frothier” but rather accumulate as frothiness expands and sell as frothiness contracts. NB: as always, this is NOT investment advice and in fact it’s an over-simplified “take” – you should note that there’s a bunch of caveats.
How to measure a bubble
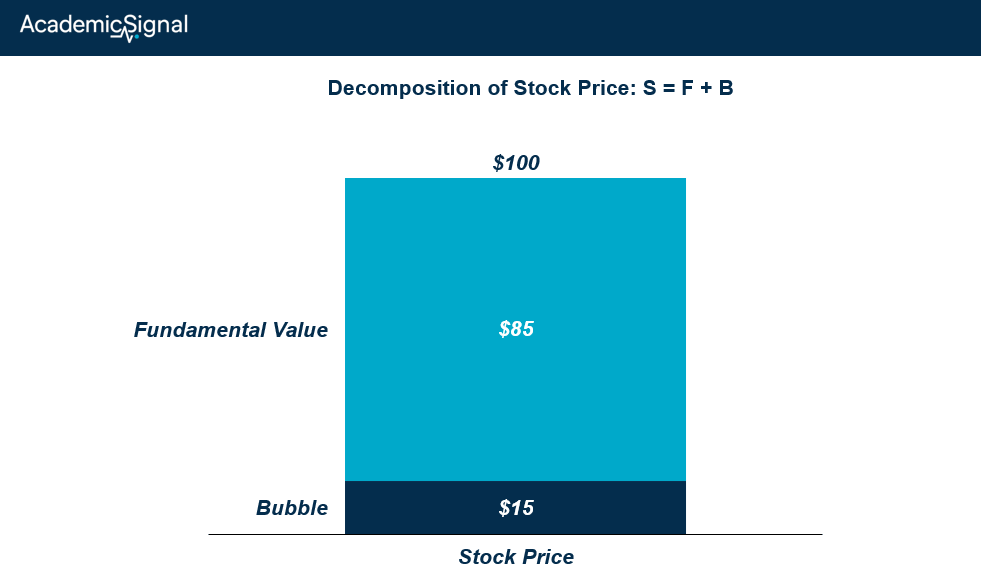
Using put option prices of different strike prices and expirations, there’s a mathematical way to figure out the implied fundamental value of a stock, so the actual price can be broken into two components:
S = F + B
S: stock price
F: fundamental value
B: ‘bubble’ or speculative premium
For example: If the stock price S is $100 but the fundamental value F is $85, then the ‘bubble’ or speculative premium of that stock is B = $100 - $85 = $15
Implications
The researchers make these key assumptions:
Eventually the stock price will go back down to its fundamental value.
During any short time-frame the stock market is a “fair game” so today’s stock price is a fair estimate of tomorrow’s price.
The key implication of these assumptions is that since the stock market is ‘fair’ and we know that eventually the stock will trade lower, in the in-between period the probability of high prices is greater than typical models would indicate (to balance out the fact that eventually the stock will drop, which creates an inherent tension – or contradiction – in the mathematical model).
How to make sense of this contradiction
If there was no anticipated upside but you knew that the fundamental value of a stock is lower than its price, why would anyone buy it, or even hold it?
You’d sell it immediately and the bubble premium would collapse to $0 so the stock price would equal its fundamental value. But we know that bubbles exist, and the only way they make sese is that there’s a probability of higher rewards that can – but not necessarily will – be captured.
You may be wondering: What if the bubble premium isn't a speculative premium and bubbles only exist because investors believe that a stock's fundamental value will increase in the future, i.e., there's a distribution of F instead of F staying constant?
However, these heterogeneous beliefs would also be reflected adequately in the options prices as well, so the differential would still need to be attributed to speculation, so the difference between S and F is indeed a ‘speculative’ premium.
Interesting feedback effect
As speculation grows, the mathematical likelihood of further growth increases – counterintuitive but mathematically sound.
The formula derived based on the researchers’ assumptions indicates that the probability of the bubble premium becoming realized is:
P(future bubble premium) = current bubble premium / future bubble premium
Therefore, these probabilities adjust dynamically all the time. Imagine this example:
S(0) = $100 ($85 fundamental value + $15 bubble premium)
P($200) = $15 / $115 = 13%
The probability of the stock hitting $200 is equal to today’s bubble premium divided by the bubble premium at $200 (note that this is a risk-neutral tail probability, not a real-world frequency, which means that actual trading would require certain calibrations)
S(1) = $150 ($85 fundamental value + $65 bubble premium)
P($200) = $65 / $115 = 57%
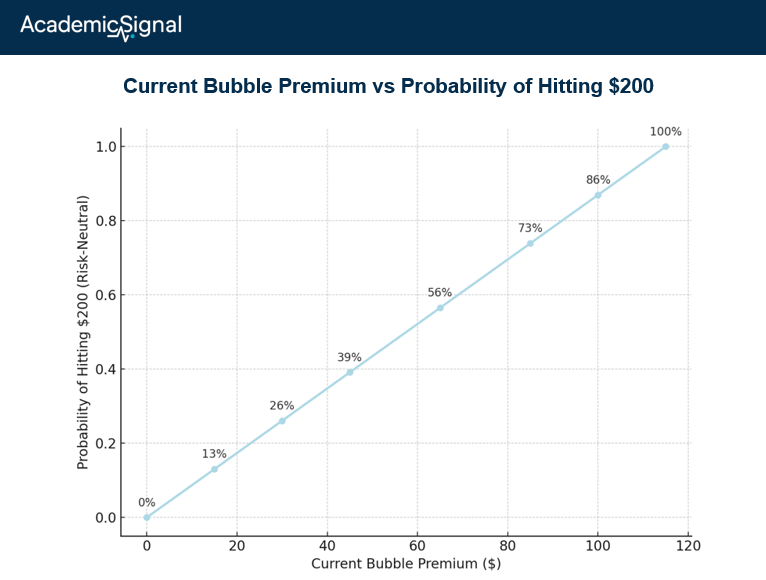
🔥 This mathematical approach actually explains the self-reinforcing nature of bubbles! Early stages show low probability of extreme moves, creating skepticism. As speculation grows, extreme moves become more likely, attracting more participants and creating momentum that eventually becomes unsustainable euphoria.
Testing the theory
The researchers designed strategies that systematically exited positions when prices hit predetermined multiples of the speculation premium. Their approach:
Only trade during confirmed speculation periods (positive premiums via options data)
Set dynamic exit targets based on speculation size rather than arbitrary price levels
Test combinations with momentum and volatility overlays
Results across 41 stocks and ETFs (1996-2023):
Best composite strategy: 6.39% annual returns vs. 4.86% buy-and-hold
Outperformed on 25 of 41 individual assets
Results hold after accounting for 0.5% transaction costs
Particularly strong during 2006-2010 bubble period
Strategic Implications
For institutional investors, the research offers several insights:
Accept and exploit bubbles: The mathematical framework suggests that bubble periods aren't just emotionally driven but follow predictable patterns that create systematic opportunities.
Risk management enhancement: The options-based methodology could provide real-time overvaluation alerts superior to traditional metrics.
Exit discipline framework: The mathematical foundation may justify more systematic profit-taking during euphoric periods when behavioral biases typically encourage holding.
Cross-sectional opportunities: The approach could identify relative value by comparing speculation premiums across assets, potentially supporting long/short strategies.
Academic bridge-building: The work demonstrates how rigorous mathematical frameworks can be applied to seemingly irrational market phenomena.
Some criticism…
The researchers show that a larger bubble premium implies higher likelihood of much higher prices. In that case, an investor would conclude that as a bubble grows they should buy more shares.
However, this would miss the idea that the whole system is mathematically unstable: there’s a bubble premium that will eventually collapse and we don’t know when; as the bubble grows, math indicates higher probability of ever higher prices, but also a much higher eventual collapse.
This creates a "picking up nickels in front of a steamroller" scenario.
It’s interesting to keep track of the ‘bubble premium’ embedded in your portfolio, and perhaps back-testing your portfolio against different bubble-trading parameters could help you generate some alpha, but you need a careful grasp of how you balance the inherent risk.
The bottom line
The work demonstrates that bubble trading may be more systematic than previously believed. The real-time measurement methodology may prove more valuable than the specific trading strategies tested.
Sometimes the most practical insights come from accepting market irrationality rather than trying to eliminate it.
Quick poll (only participants will receive the results)
Will you be exploring your portfolio’s bubble premium and how to exploit it? |