- Academic Signal
- Posts
- ROIIC and Sector-Specific Factors: Smarter Drivers of Value
ROIIC and Sector-Specific Factors: Smarter Drivers of Value
New research highlights ROIIC—not ROIC—as the forward signal for multiple expansion, and shows how sector-specific factors (like in REITs) sharpen attribution and cut false alpha.


Actionable insights from academic research.
Welcome to Academic Signal, where we decode finance research into plain English to surface ideas that matter to professional investors.
In this week’s report:
ROIIC: a better predictor of multiple expansion
Upgrade your attribution models with sector-specific factors
1. ROIIC: a better predictor of multiple expansion
Investment Process: Growth, ROIC & ROIIC as Long-Term Value Drivers (June 24, 2025) - Link
Growth only creates value if the reinvested dollar earns above the cost of capital. That is standard McKinsey, and a useful mental model is the no-growth P/E, which is about 1/r (where “r” is the cost of capital). At an 8% cost of capital, that is ~12.5x. Growth only raises that “justified” multiple when the reinvested dollar clears the hurdle.
The paper argues that ROIIC (return on incremental invested capital) is the forward driver to watch, not headline ROIC. ROIC tells you how yesterday’s dollars performed. ROIIC asks what the next dollar will earn. Markets pay for where returns are going, not where they have been.
When ROIIC is above the ROIC hurdle, ROIC will drift up and multiples tend to follow; when ROIIC slips, even great businesses can derate. Case studies include Walmart vs Target and Apple.
You can make money when a mediocre ROIC business improves its incremental returns, and lose money when a high-ROIC franchise deploys the next dollar poorly.

How to estimate ROIIC in practice
Start with the definition: ROIIC can be estimated with the change in NOPAT divided by the change in invested capital over a period long enough to smooth noise. Track it over rolling windows and by segment if possible. Adjust for buybacks, large M&A, and capitalized R&D so you are measuring true incremental deployment, not accounting artifacts.
Use ROIC trend as a proxy only when disclosure is thin, but treat it as backward-looking. The better path is to form a forward view by mapping where the next $100M of capital is going and what management expects it to earn. You can build this from MD&A, transcripts, capex guidance, unit-economics disclosures, and industry calls with customers or suppliers.
Example: Chipotle (CMG)
CMG shows why ROIIC beats ROIC. Recent ROIC prints hover around 20-25%. That is strong, but it mixes old and new investments and is slow to move. Meanwhile, the company continues to add units at attractive economics, supported by restaurant-level margins that remain high by industry standards. The forward signal is the return on the next dollar: year-2 cash-on-cash returns on new restaurants are ~60%, versus a WACC around ~10%. That spread explains why Chipotle can keep compounding even when near-term comps wobble.
Bottom line
Don’t over-index on ROIC screens. Underwrite the next dollar (the direction of ROIC). In the CMG example, track three things each quarter: new-unit cash-on-cash, AUV progress toward $4M, and your WACC band. Those will tell you more about forward value creation than ROIC alone.
The cleanest edge is often in dull places where ROIIC is quietly improving.
2. Upgrade your attribution models with sector-specific factors
REIT Factors (May 27, 2025) - Link
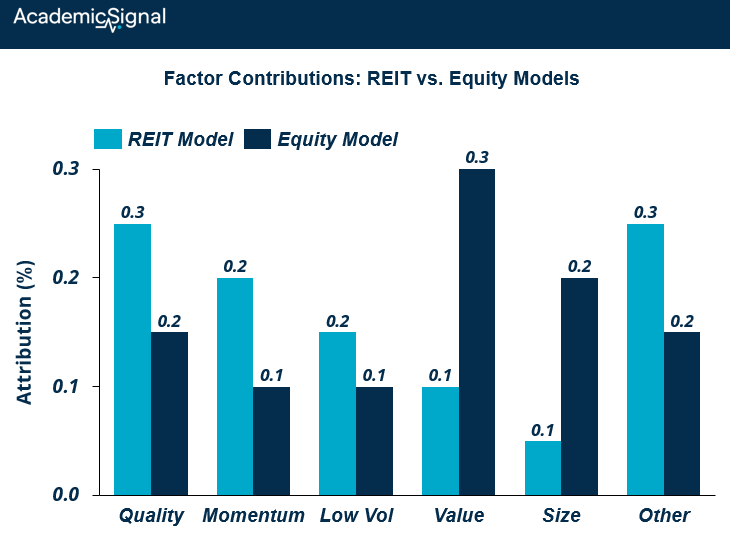
The authors build six REIT-specific factors and show that they explain REIT returns better than stock-market factor models. Short-term reversal, momentum, quality, and low volatility work; size is weak; value only helps after you clean its unwanted exposures.
Their REIT model increases firm-level median R-squared (the share of variance explained by your predictors) by 33% vs general equity models and cuts unexplained alpha by nearly 3% per year.
Quick refresher: what are “factors”?
Think of a factor as a rules-based characteristic that explains why certain securities tend to earn different returns. Examples: recent performance (momentum), price relative to fundamentals (value), profitability or accruals (quality), and volatility.
A factor portfolio is the long-short spread you get by ranking securities on that characteristic and buying the top group while selling the bottom group.
In this paper, the same idea is applied inside the REIT universe, not across all stocks. This means that the authors derive factors by ranking REIT stocks only.
How REIT factors differ from equity factors
The generic Momentum factor is derived by ranking all equities by momentum and creating a long-short portfolio. The REIT-specific version of the Momentum factor only takes into account REIT stocks.
When the authors compare their REIT factors with the usual stock-market analogs, several REIT factors still earn positive alpha.
What does it mean that “factors still earn positive alpha”?
Alpha is the return left over after you explain an asset’s performance with a set of risk factors. If you take a REIT factor (say REIT momentum) and regress it on the stock-market versions of the same factor plus the usual equity risk factors, a positive intercept says there is residual return that the stock factors could not explain. That intercept is “unique alpha.”
For example, REIT momentum is momentum measured inside the REIT universe. In practice you sort REITs by past returns (commonly the last 12 months, skipping the most recent month), buy the recent winners, and sell the losers. That is the same construction idea as equity momentum, but the universe is only REITs, so it captures real-estate-specific trends rather than broad stock effects.
The authors demonstrate that REIT-specific factors earn positive alpha and therefore carry significant real-estate-specific information.
That’s why the REIT model materially improves fit and reduces fake alpha that comes from using the wrong risk model.
Why this matters
If you manage a REIT sleeve or analyze REIT managers, using stock-only factors can misstate skill and risk. A REIT-specific model gives tighter attribution, more realistic tracking error, and fewer false positives on alpha.
What you can do now
Update your risk model for REITs. Add the six REIT factors for performance attribution and risk control, rather than leaning only on stock factors.
Tilt long-only portfolios toward the winning characteristics. Favor higher quality, lower volatility, recent winners, and names that were recently oversold, while being cautious on raw value and size. Recheck value after purging its momentum, quality, and volatility exposures.
What does it mean to “purge” the Value factor’s exposures?
It means to strip out the parts of your REIT Value signal that are actually coming from Momentum, Quality, or Low Vol. The paper finds Value only earns a clean premium after you do that.
The most common way to accomplish this ‘stripping’ would be: Cross-sectional residualization
At each rebalance date:
Compute your raw REIT Value score for every REIT.
Also compute standardized Momentum, Quality, and Low-Vol scores for the same names.
Run a cross-sectional regression of Value on those other scores and keep the residuals:
Value_purged = Value_raw − b1*Momentum − b2*Quality − b3*LowVol.
Rank on Value_purged to build the “pure Value” long-short portfolio.
This is “orthogonalization by regression”: the residuals are Value with the other signals removed. (Cross-sectional regression is the standard tool for factor construction and for making “pure” factors.)
Bottom line
REITs have their own return anatomy. If you treat them like generic equities, you will leave information on the table.
Taking this a step further… how to port this framework to any sector?
The REIT paper’s playbook should generalize to other industries (assuming sector-specific factors earn alpha).
How to port the framework to any sector:
Define the universe. Use a clean GICS sector or industry group.
Pick sector-native signals. Start from the economics of that sector, not a data mine.
Construct factors inside the sector. Rank names on the signal, form top minus bottom long-short, rebalance on a set schedule.
Test incremental value. Regress your sector factor on the market and standard style factors, plus the sector return. If the intercept stays positive and your portfolio-level R-squared rises, you have a real sector driver, not a relabeled equity factor.
Implement. Add the factor to your risk model or tilt a long-only sleeve, subject to turnover and capacity limits. Vendors support adding custom factors and orthogonalizing them to avoid double counting.
Why this makes sense
Industry co-movement is powerful. A classic result is that a lot of single-stock momentum is really industry momentum. Sector effects can explain returns that a market-wide model misses.
Concrete sector examples to copy today
Energy: Build an oil-beta factor for energy stocks. Estimate each name’s exposure to identified oil shocks or to front-month oil returns, then form a high minus low oil-beta spread within energy. Oil demand and supply shocks show up in equity returns, and mapping that into a sector factor improves attribution.
Banks: Add rate and term-structure sensitivity. Bank equity responds to interest rate changes, with exposure linked to balance sheet structure. A bank sector factor based on rate betas can tighten fit and shrink spurious alpha.
Utilities: Include an interest-rate factor. Utilities often behave like bond proxies. Their rate beta varies with credit quality, which you can capture in a within-utilities factor.
Biotech and pharma: Use event-based factors tied to clinical and FDA milestones. Large event studies show material stock reactions around trial results and approvals, so an event exposure or pipeline-progress proxy can add explanatory power inside this sector.
How to judge success
Run a horse race. Attribute your sector book with the standard model, then with the model plus your new sector factor. You want higher R-squared, lower residual alpha, and a sector factor that earns positive alpha after controlling for broad factors and the sector return. This is the same logic behind the REIT paper’s result that REIT-specific factors boost fit and reduce false alpha.