- Academic Signal
- Posts
- US equities may be cheaper than you think + evidence that weaker debt monitoring leads to fewer defaults
US equities may be cheaper than you think + evidence that weaker debt monitoring leads to fewer defaults
In this week’s report: Why US equities are more attractive than the Fed model indicates - equivalent PE of ~15x vs. observed PE >25x and The PIK Debt Paradox: evidence that weaker debt monitoring leads to fewer defaults

Actionable insights from academic research.
Welcome to Academic Signal, where we decode finance research into plain English to surface ideas that matter to professional investors.
In this week’s report:
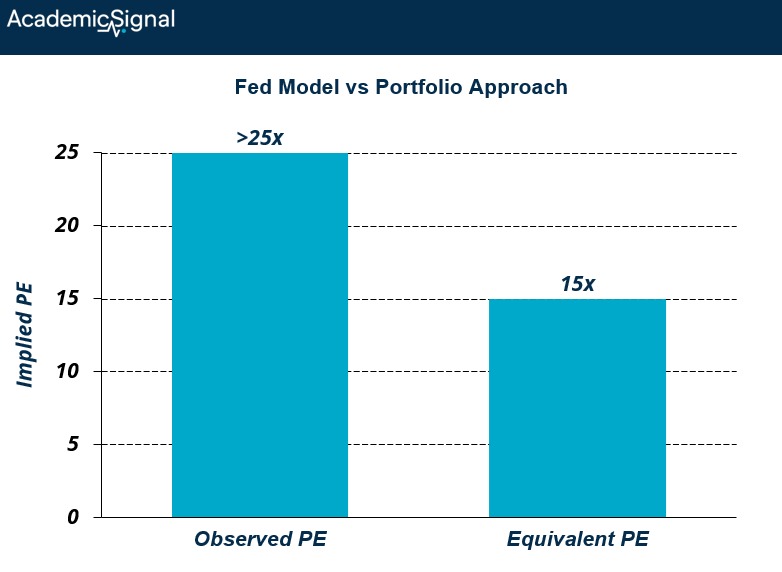
Why US equities are more attractive than the Fed model indicates - equivalent PE of ~15x vs. observed PE >25x
The PIK Debt Paradox: evidence that weaker debt monitoring leads to fewer defaults
Why US equities are more attractive than the Fed model indicates (equivalent PE of ~15x vs. observed PE >25x)
A Portfolio Approach to Valuing US Equities (October 7, 2025) - Link to paper
TLDR
A new valuation framework infers equity risk premia by assuming the "Market Portfolio" (all US cash, bonds, and equities) is optimal for investors
The approach suggests US equities are more attractive than the Fed model indicates - equivalent PE of ~15x vs. observed PE >25x
Stock-bond correlation and bond volatility are the most critical parameters; a repeat of the 2022 scenario (both rising) would significantly hurt equity valuations
They built a valuation model around the "Market Portfolio" - the aggregate holdings of US T-Bills ($6.2T), government bonds ($13.6T), and equities ($65.7T). Current weights: 7.3% cash, 15.9% bonds, 76.8% equities.
The key insight: If investors thought stocks were terrible investments, they wouldn't hold 77% of their wealth in them. If they thought bonds were amazing, they'd hold more than 16%. The fact that people hold these specific weights tells us something about what returns they expect.
The paper uses portfolio math to reverse-engineer: "What expected returns for stocks and bonds would make this 7/16/77 split the optimal choice?"
A concrete example:
Let's say stocks have 20% volatility and bonds have 5% volatility, and they have -30% correlation (meaning when stocks fall, bonds often rise - a diversification benefit).
Given these risk characteristics, the model calculates: "For investors to willingly hold 77% stocks and only 16% bonds, they must expect stocks to beat bonds by X% per year."
If that X% is large, it means stocks need to deliver high returns to justify their risk → stocks are cheap. If X% is small, stocks don't need to deliver much → stocks are expensive.
What makes this different from traditional valuation?
The Fed model says: "Stocks are expensive because their earnings yield (1/PE = earnings/price) is lower than bond yields."
Current numbers:
Stock earnings yield ≈ 4% (if PE is 25x)
10-year Treasury yield ≈ 4.5%
Fed model says: Stocks are expensive!
But the Portfolio Approach says: "Wait - you're forgetting that stocks and bonds play different roles in a portfolio."
Why correlation matters so much:
Imagine you're deciding between two investments:
Scenario A (negative correlation):
Stocks: 8% expected return, 20% volatility
Bonds: 4% expected return, 5% volatility
When stocks crash, bonds often rally (negative correlation)
Holding both together smooths out your portfolio
Scenario B (positive correlation):
Same returns and volatilities
But now when stocks crash, bonds crash too (positive correlation)
Much scarier to hold both!
In Scenario A, stocks are more attractive because they're paired with a good diversifier. In Scenario B, you might want to hold fewer stocks even if expected returns are identical.
The 2022 example:
Historically, stock-bond correlation was negative (around -30%). This made stocks attractive because bonds cushioned the blow during equity selloffs.
In 2022:
Inflation surged → interest rates rose → bond prices fell
At the same time, stocks fell
Correlation flipped positive
Bond volatility spiked
Suddenly the "balanced portfolio" wasn't balanced anymore
The Portfolio Approach captures this: when correlation rose and bond volatility spiked, the model's equity valuation signal plummeted. Stocks became less attractive not because fundamentals changed, but because the portfolio math changed.
Current reading:
Today:
Stock-bond correlation: ~10% (slightly positive, but not terrible)
Bond volatility: ~5% (moderate)
Model says: Equities equivalent PE ≈ 15x
Even though the actual PE is above 25x (expensive!), the Portfolio Approach says "that's okay" because:
Correlation is still relatively low (stocks and bonds still somewhat diversify each other)
Bond volatility is moderate (bonds aren't super scary)
At these portfolio weights, stocks look reasonably valued
What’s an “equities equivalent PE”?
The Portfolio Approach says: "Given current portfolio weights, volatilities, and correlation, investors must expect equities to return X% per year."
Let's use realistic numbers:
Model says expected bond return over cash: 0.3% per year
Model says expected equity return over cash: 7.0% per year
Therefore equities are expected to beat bonds by: 6.7% per year
Converting returns to PE: Now they flip this around. If equities should deliver 6.7% per year, then:
"Fair" earnings yield = 6.7%
"Fair" PE = 1/0.067 = 15x
This is the "equivalent PE" - it's the implied PE according to the model's return expectations.
Bottom line for investors:
Traditional valuation looks at stocks in isolation. This approach looks at stocks in the context of your whole portfolio. Stocks can be "expensive" on PE but still attractive if they play a valuable role in diversification. Monitor stock-bond correlation and bond volatility as key risk indicators.
The PIK Debt Paradox: evidence that weaker debt monitoring leads to fewer defaults
Payment-In-Kind (PIK) Debt (October 8, 2025) - Link to paper
TLDR
PIK bonds allow borrowers to defer interest payments by issuing additional debt rather than paying cash coupons. Despite charging 1.8% higher yields and appearing to weaken lender control, PIK bonds are 15% less likely to default than comparable regular high-yield bonds after controlling for issuer characteristics. This payment flexibility helps financially constrained, high-growth firms avoid costly defaults triggered by temporary liquidity shocks.
What the structure means
PIK debt eliminates the traditional monitoring mechanism of periodic cash coupon payments. Three variants exist: PIK-Only (all interest deferred), PIK-Cash (partial deferral), and PIK-Toggle (borrower chooses each period). Unlike zero-coupon bonds issued by strong credits, PIKs are high-risk instruments primarily used in leveraged buyouts and dividend recaps, sold privately to institutional investors like hedge funds and BDCs.
The IMF has flagged PIK income – now 9% of BDC interest income – as a financial stability concern, arguing that deferred payments weaken creditor discipline and allow risky debt accumulation.
The counter-intuitive findings
Using 444 PIK bonds and 8,172 regular high-yield (RHY) bonds issued 2006-2022, researchers documented striking patterns.
While PIK bonds show a 21% average default rate versus 12% for RHY bonds, this reverses after controlling for observable characteristics at issuance. Using only matured bonds to avoid censoring bias (= potential distortion in the results caused by not knowing the final outcome for bonds that haven't matured yet), PIKs are 15% less likely to default with statistical significance across multiple model specifications.
Critically, PIK defaults aren't concentrated near maturity as theory would predict if deferred monitoring simply postpones the day of reckoning. The Nelson-Aalen cumulative hazard analysis (= a statistical technique for analyzing the timing of defaults, not just whether they happen) shows PIK bonds actually experience fewer late-stage defaults, with the hazard function nearly flat in the final 25% of bond life.
The researchers wanted to test whether PIK bonds just delay defaults until near maturity. If the PIK structure simply allows weak companies to limp along until their debt balloons, you'd expect the cumulative hazard curve to shoot up near the end - lots of defaults concentrated around maturity.
The lower default rate holds even after excluding yield spreads and credit ratings from controls – addressing concerns that investors simply demand higher yields or rating agencies apply stricter standards to PIKs. Cox proportional hazard models confirm PIK default risk is 67-86% lower than comparable RHY bonds. This is a method for analyzing "time-to-event" data - in this case, time from bond issuance to default. It asks: "What factors make default more or less likely at any given moment?"
Who issues PIKs and why
PIK issuers are systematically different: smaller, younger, more leveraged (75% vs. 50% book leverage), with higher cash flow volatility and lower profitability. They're more financially constrained (higher Whited-Wu Index) and 48% have negative book equity versus 16% for RHY issuers.
Crucially, PIK issuers demonstrate higher Tobin's Q (1.93 vs. 1.59), indicating greater perceived growth potential. This combination—high liquidity risk but valuable growth options—explains the financing choice. Growth options are intangible and difficult to preserve in bankruptcy, making default especially costly for these firms.

Investment implications
The findings suggest PIK bonds' 1.8% yield premium isn't fully explained by default risk. Payment flexibility genuinely reduces default probability by helping borrowers weather temporary shocks. For credit investors, this means:
PIKs offer compensation beyond default risk – possibly for illiquidity, interest rate duration, or recovery risk;
careful PIK selection based on growth potential and active management quality can generate alpha; and
the PIK-Toggle structure is most effective at reducing defaults.
This challenges the narrative that all covenant-lite or borrower-friendly structures simply transfer risk to lenders.
Why it matters: This paper directly addresses a rapidly growing segment of credit markets ($183B issuance in sample) with counter-intuitive findings that challenge conventional wisdom about default risk and monitoring. The insights are immediately actionable for high-yield bond investors and relevant to understanding the $2+ trillion private credit market.
Disclaimer
This publication is for informational and educational purposes only. It is not investment, legal, tax, or accounting advice, and it is not an offer to buy or sell any security. Investing involves risk, including loss of principal. Past performance does not guarantee future results. Data and opinions are based on sources believed to be reliable, but accuracy and completeness are not guaranteed. You are responsible for your own investment decisions. If you need advice for your situation, consult a qualified professional.